SUNDAE IN PRACTICE

See the work. Review the evidence.

Explore native product workflows and anonymized customer stories. Understand what each example shows, then bring a relevant question to a walkthrough.

Inside Sundae Crew

Review reusable task templates, searchable shift records and tip-pool configuration. Each view explains the capability it supports.

Inside Sundae Crew

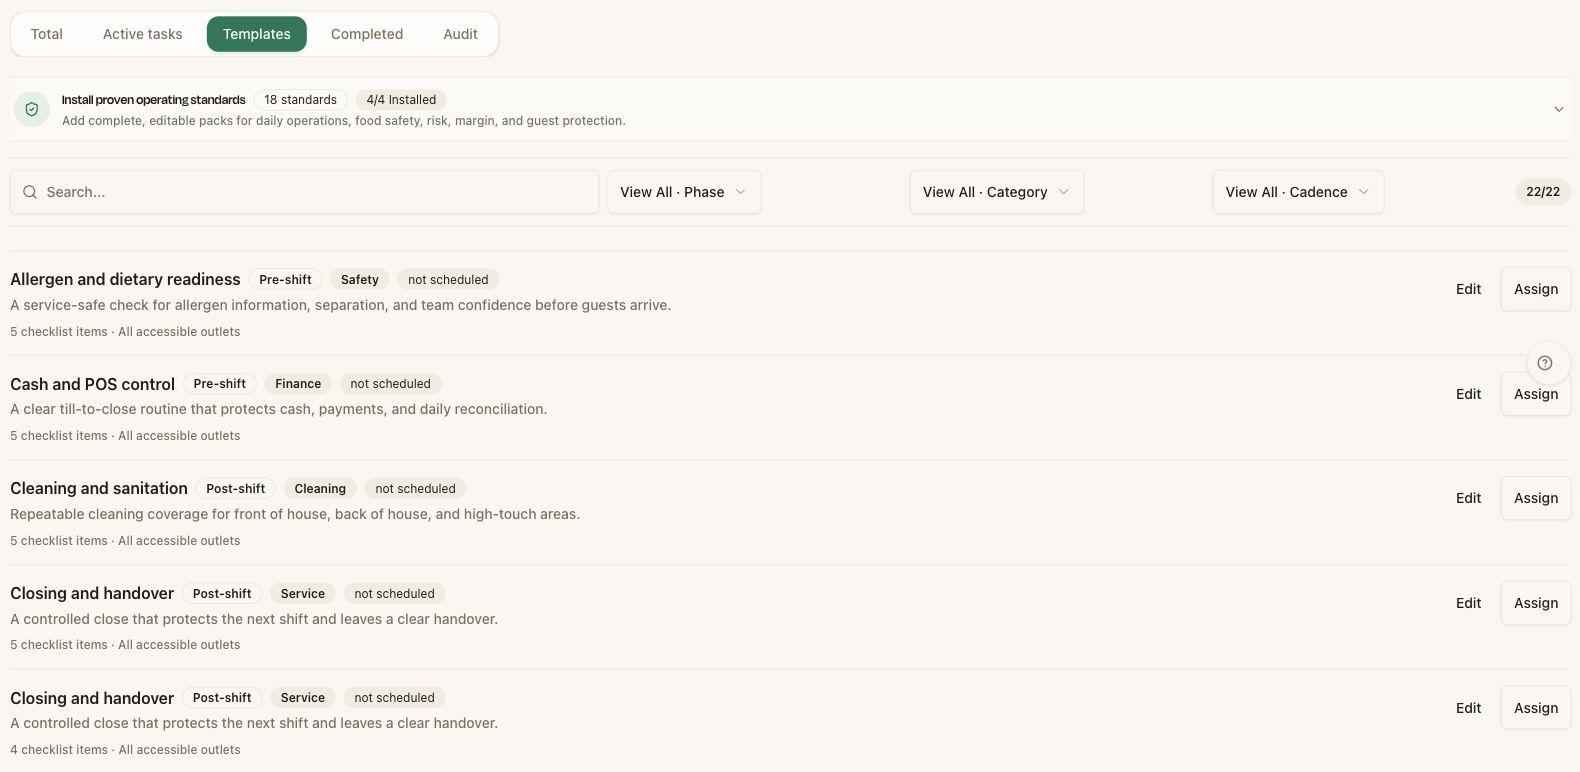
Reusable templates for the daily routine.

Reusable templates for the daily routine.

Native product view · Demo data · English interface. Figures are not customer results.

Open full-size view ↗

Inside Sundae Crew

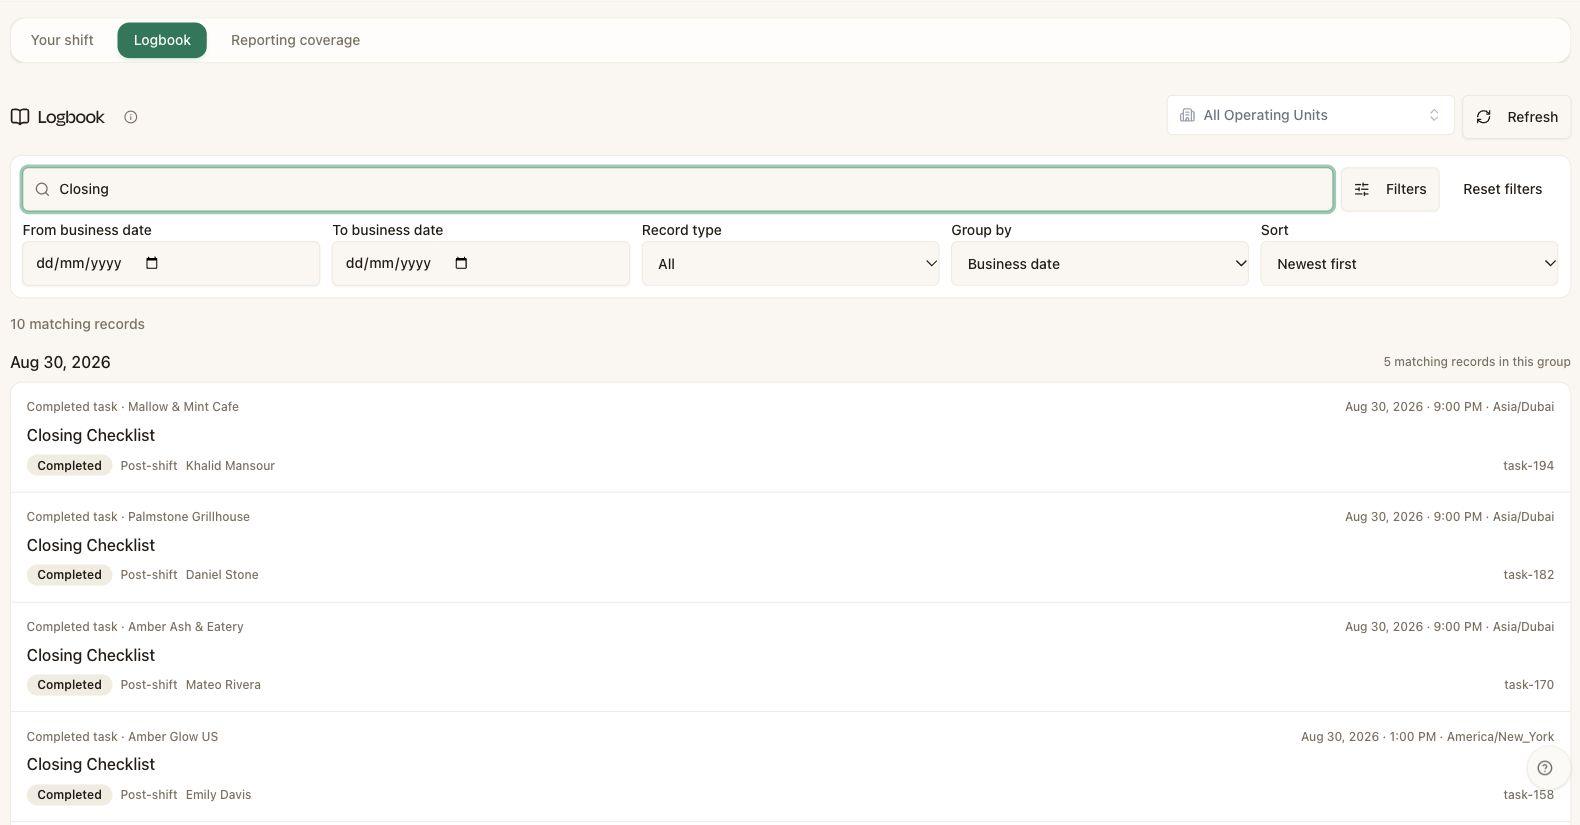
Search closing records across locations.

Search closing records across locations.

Native product view · Demo data · English interface. Figures are not customer results.

Open full-size view ↗

Inside Sundae Crew

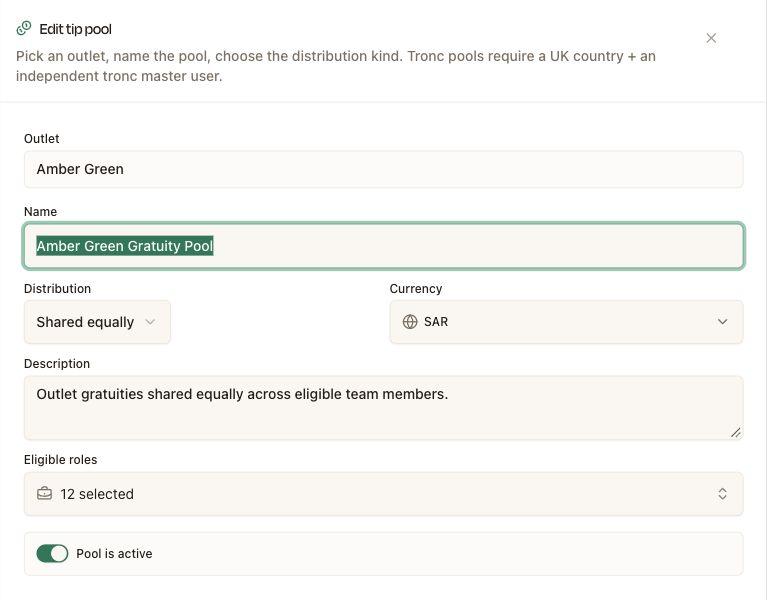
Review each location’s tip-pool setup.

Review each location’s tip-pool setup.

Native product view · Demo data · English interface. Figures are not customer results.

Open full-size view ↗

Sundae Core

Core brings your operating data, peer comparisons and relevant market signals together to explain changes in sales, costs and profit. Ask questions, explore forecasts, assign the next action and check whether it helped.

Sundae Core →

Customer stories, with their context.

These are real, anonymized customer stories. Read the operating challenge, the Sundae capabilities used and the reported outcomes together.

Multi-Brand Restaurant Group · GCC

Labor Cost Variance

35-location restaurant group struggled with 18% labor cost variance across locations with no visibility into root causes or scheduling efficiency.

Sundae Solution:

  • Sundae Core · Labor analysis
  • Sundae Core · Scheduling and turnover signals
  • Benchmarks · Labor performance comparisons

Reported outcomes

Labor cost reduction
5%
Scheduling efficiency
+12%
Decision speed
3x faster

Global Franchise · 150+ Locations

Menu Pricing & Margin Erosion

International franchise operator facing 8% food cost variance across regions with delayed insights on pricing effectiveness and discount abuse.

Sundae Solution:

  • Sundae Core · Pricing analysis
  • Sundae Core · Margin monitoring
  • Benchmarks · Category performance comparisons

Reported outcomes

Margin improvement
+3.2%
Discount abuse detected
Early
Pricing decisions
Real-time

Cloud Kitchen Operator · Multi-City

Operational Blind Spots

Fast-growing cloud kitchen network with fragmented data across 8 delivery platforms, unable to unify performance metrics or detect vendor issues.

Sundae Solution:

  • Sundae Core · Connected operating data
  • Sundae Core · Delivery performance analysis
  • Sundae Core · Unified operating views

Reported outcomes

Data unification
8 platforms
Issue detection
48hrs faster
Revenue optimization
+6%

Enterprise Hospitality Group · Regional

Market Positioning

Hospitality operator with limited visibility into competitor pricing, category trends, and market share across 22 locations in competitive markets.

Sundae Solution:

  • Watchtower · External market signals
  • Benchmarks · Peer performance comparisons
  • Sundae Core · Operating analysis

Reported outcomes

Market share growth
+2.3%
Competitive response time
Days → Hours
Pricing optimization
+4%

What would useful evidence look like for you?

Choose a workflow or operating question. We can show the relevant product view and discuss how to measure a result in your operation.