Loading...
Sundae Core
Find the Leak. Recover the Profit.
Connected to your POS, labor, inventory, and every system that matters. Core finds the profit leak, routes the fix to an accountable owner, and measures the recovered margin against a baseline.
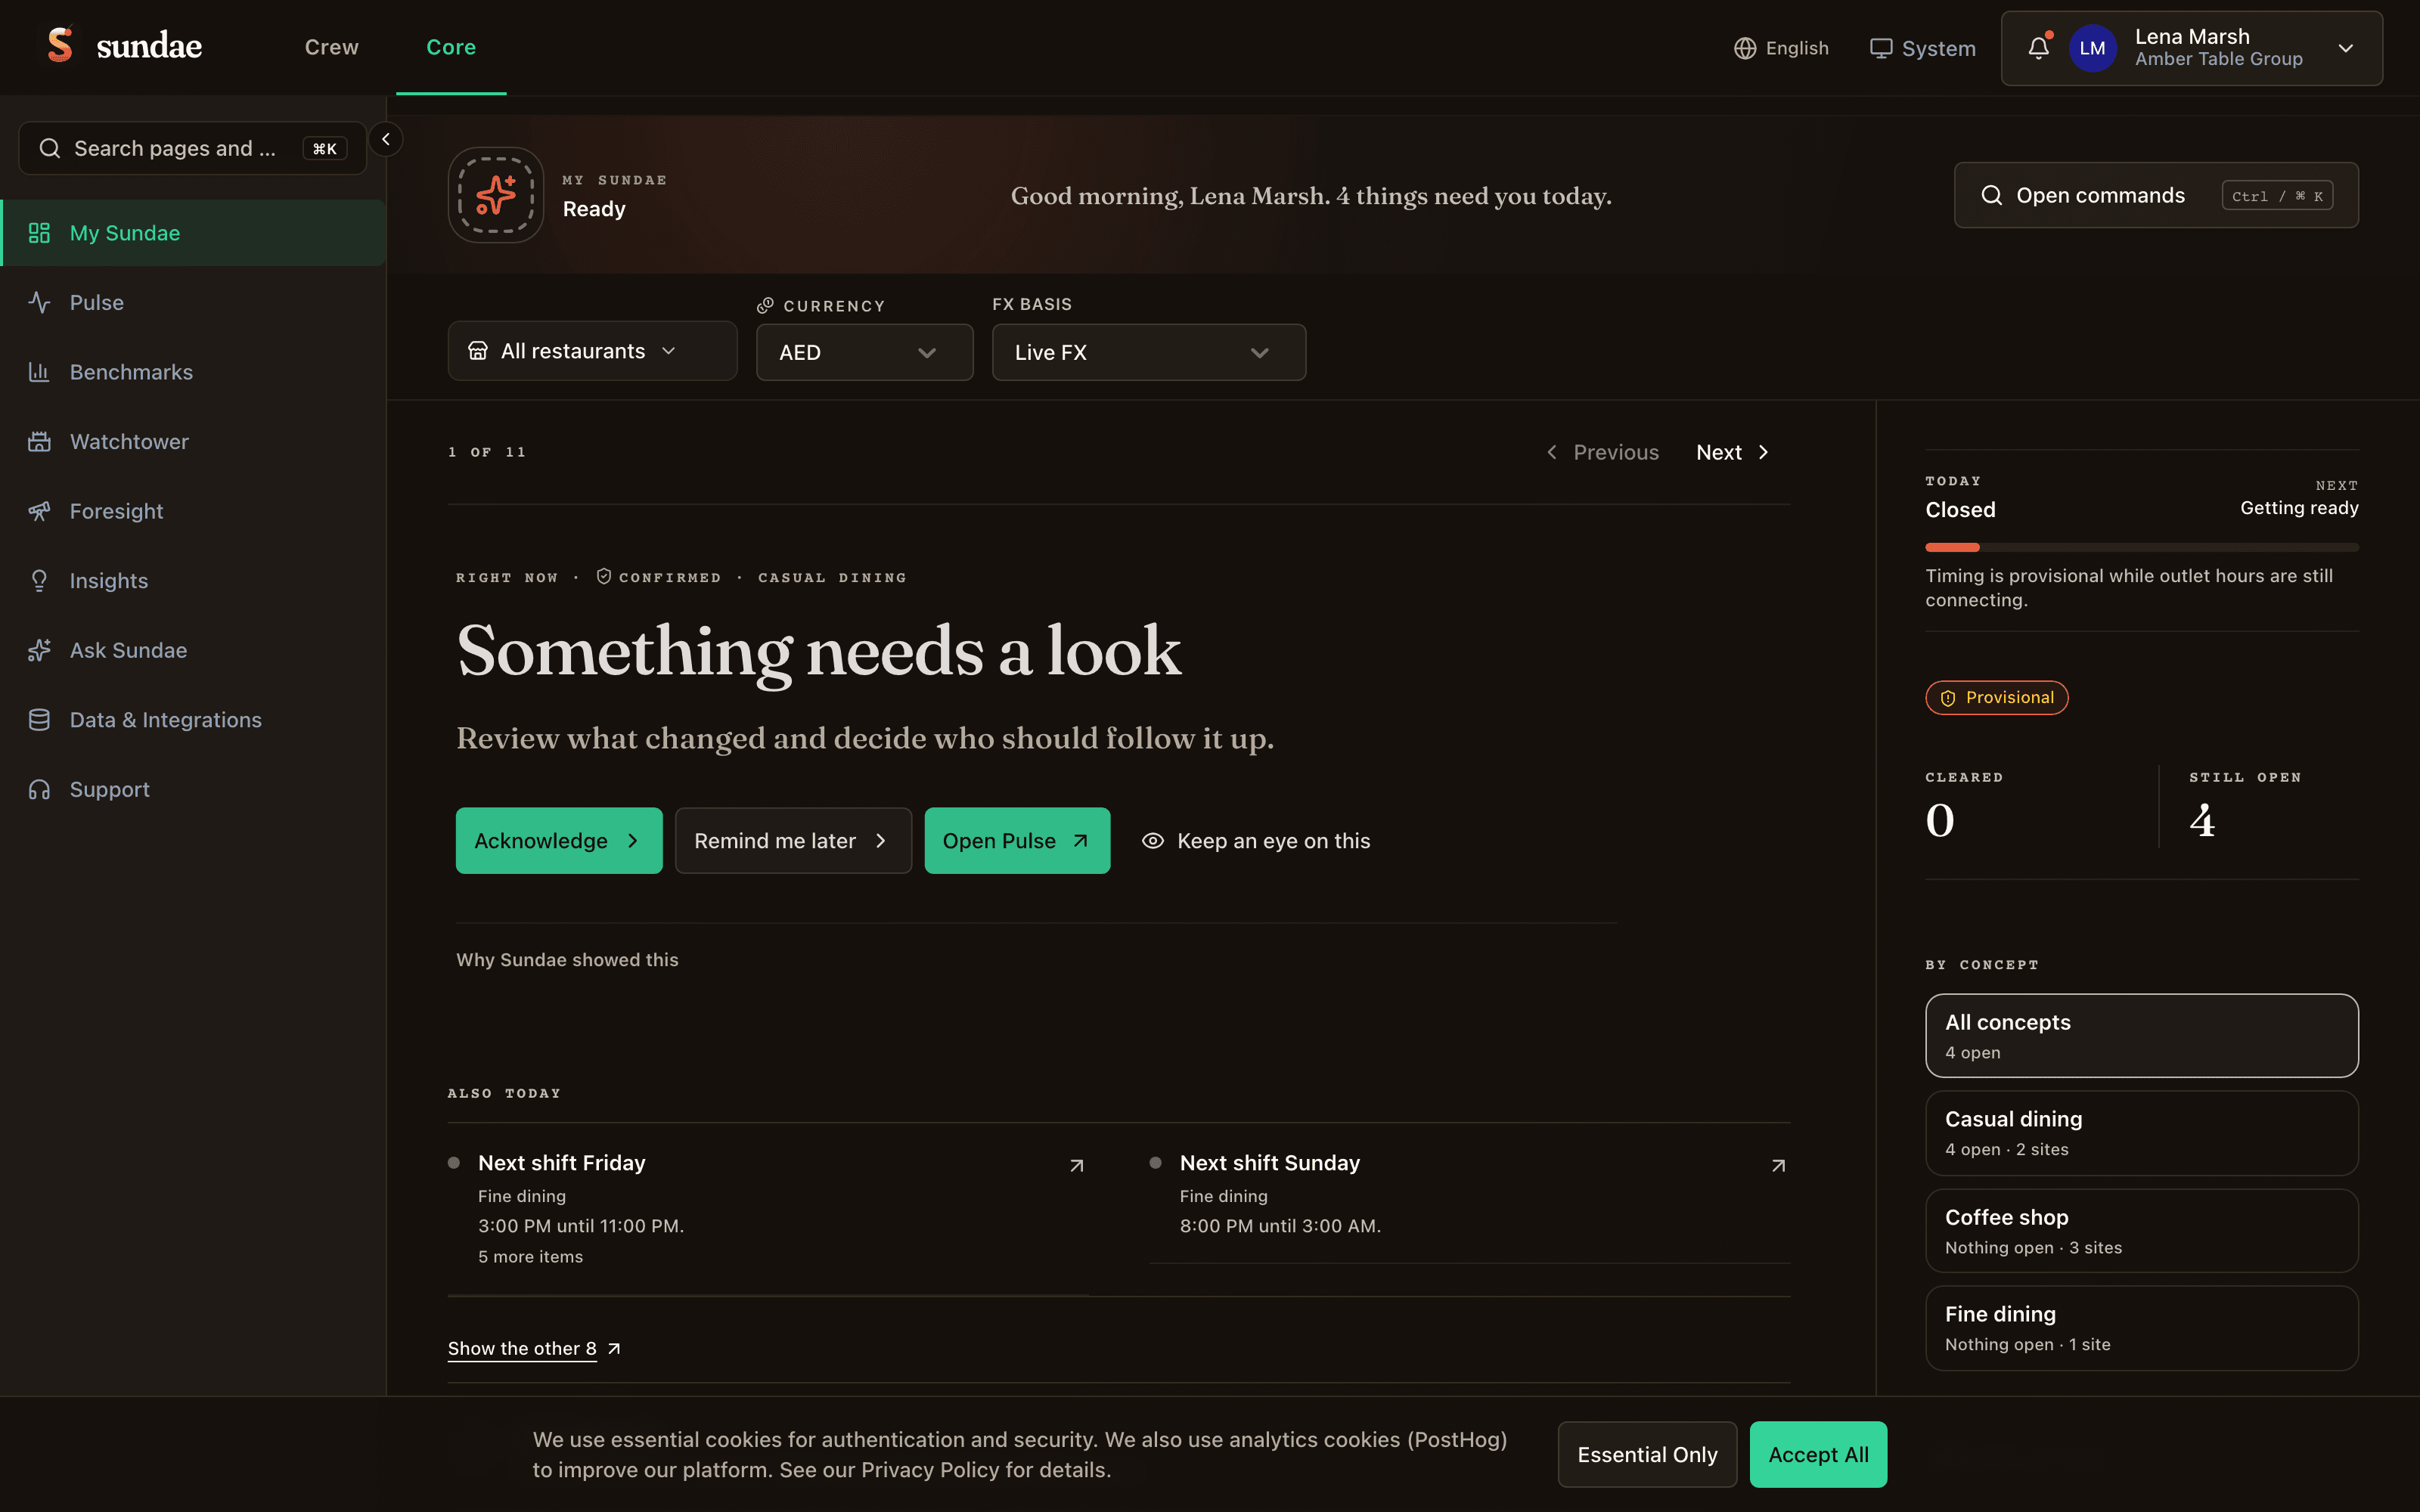

The Closed-Loop Intelligence Layer
Built for operators who need the money back, not another dashboard. Whether you manage 10 locations or 100+, Core finds what's leaking, routes the fix to a named owner, and measures the recovered margin against a baseline - so every decision closes the loop.
Measured, Not Just Flagged
Sundae Coach routes each leak to an accountable owner, then measures the recovered margin against a baseline - not a dashboard that only updates.
Every Location, One View
Unified visibility across all locations. Portfolio-level patterns and location-level detail in a single pane.
Grows With You
From one location to a thousand. The package sets the depth; the location bands set the price as you add sites.
HOW YOU KNOW IT'S REAL
Anyone can claim recovery. Sundae lets you check.
A recovered number is only worth trusting if you can see whether it truly happened. Sundae answers the three questions a careful operator - or their CFO - always asks.
Is the loop actually closing?
Loop Health
See how many detected leaks actually reach a measured result - the real close-rate, not a vanity count. It is the one number that tells you the loop is working, and it stays honest when that number is low.
Would that have happened anyway?
Like-for-like baselines
Every recovered number is measured against a matching, full-week baseline - same days, same rhythm - so a real gain is never mistaken for an ordinary busy week.
Did it pay for itself?
Return on Sundae
See the value you recovered set against what you pay, period by period - the proof, in measured money, that Sundae more than covers its cost.
And when the evidence isn't there, Sundae says so. Every result stays directional until a human confirms it, and a detector stays silent rather than invent a number.
THE COMMAND CENTER
One surface for the whole business.
Pulse, benchmarks, analytics, and AI - the operator's daily home.
WHERE THE MARGIN GOES
Four places profit leaks. Your package decides which ones you close.
Start from the loss, not the licence. Each package covers a different set of the four - Core Performance covers all of them.
Revenue & Profit
Voids, comps, discounts and mispriced items that never show up as a line you can question.
Core covers it with Revenue and profit intelligence, revenue assurance, item-level contribution.
Food & Supply
The gap between what you ordered, what you used and what you sold - waste, variance and vendor price drift.
Core covers it with Inventory and purchasing intelligence, theoretical versus actual usage, supplier movement.
Guest & Market
Covers that never arrive, guests who do not return, and channel margin eaten after commission.
Core covers it with Guest experience and CRM, reservations, delivery economics, marketing attribution, peer benchmarks.
Foresight & Action
Decisions taken late, on last month's numbers, with no way to tell afterwards whether they worked.
Core covers it with Forecasting, scenario modelling and the approve-in-the-loop action layer. An expansion on top of Core.
Included with Core
Pulse: Your Shift Command Center
See anomalies the moment they happen. Route the fix to the manager on shift. Then measure the margin you recovered against the baseline.
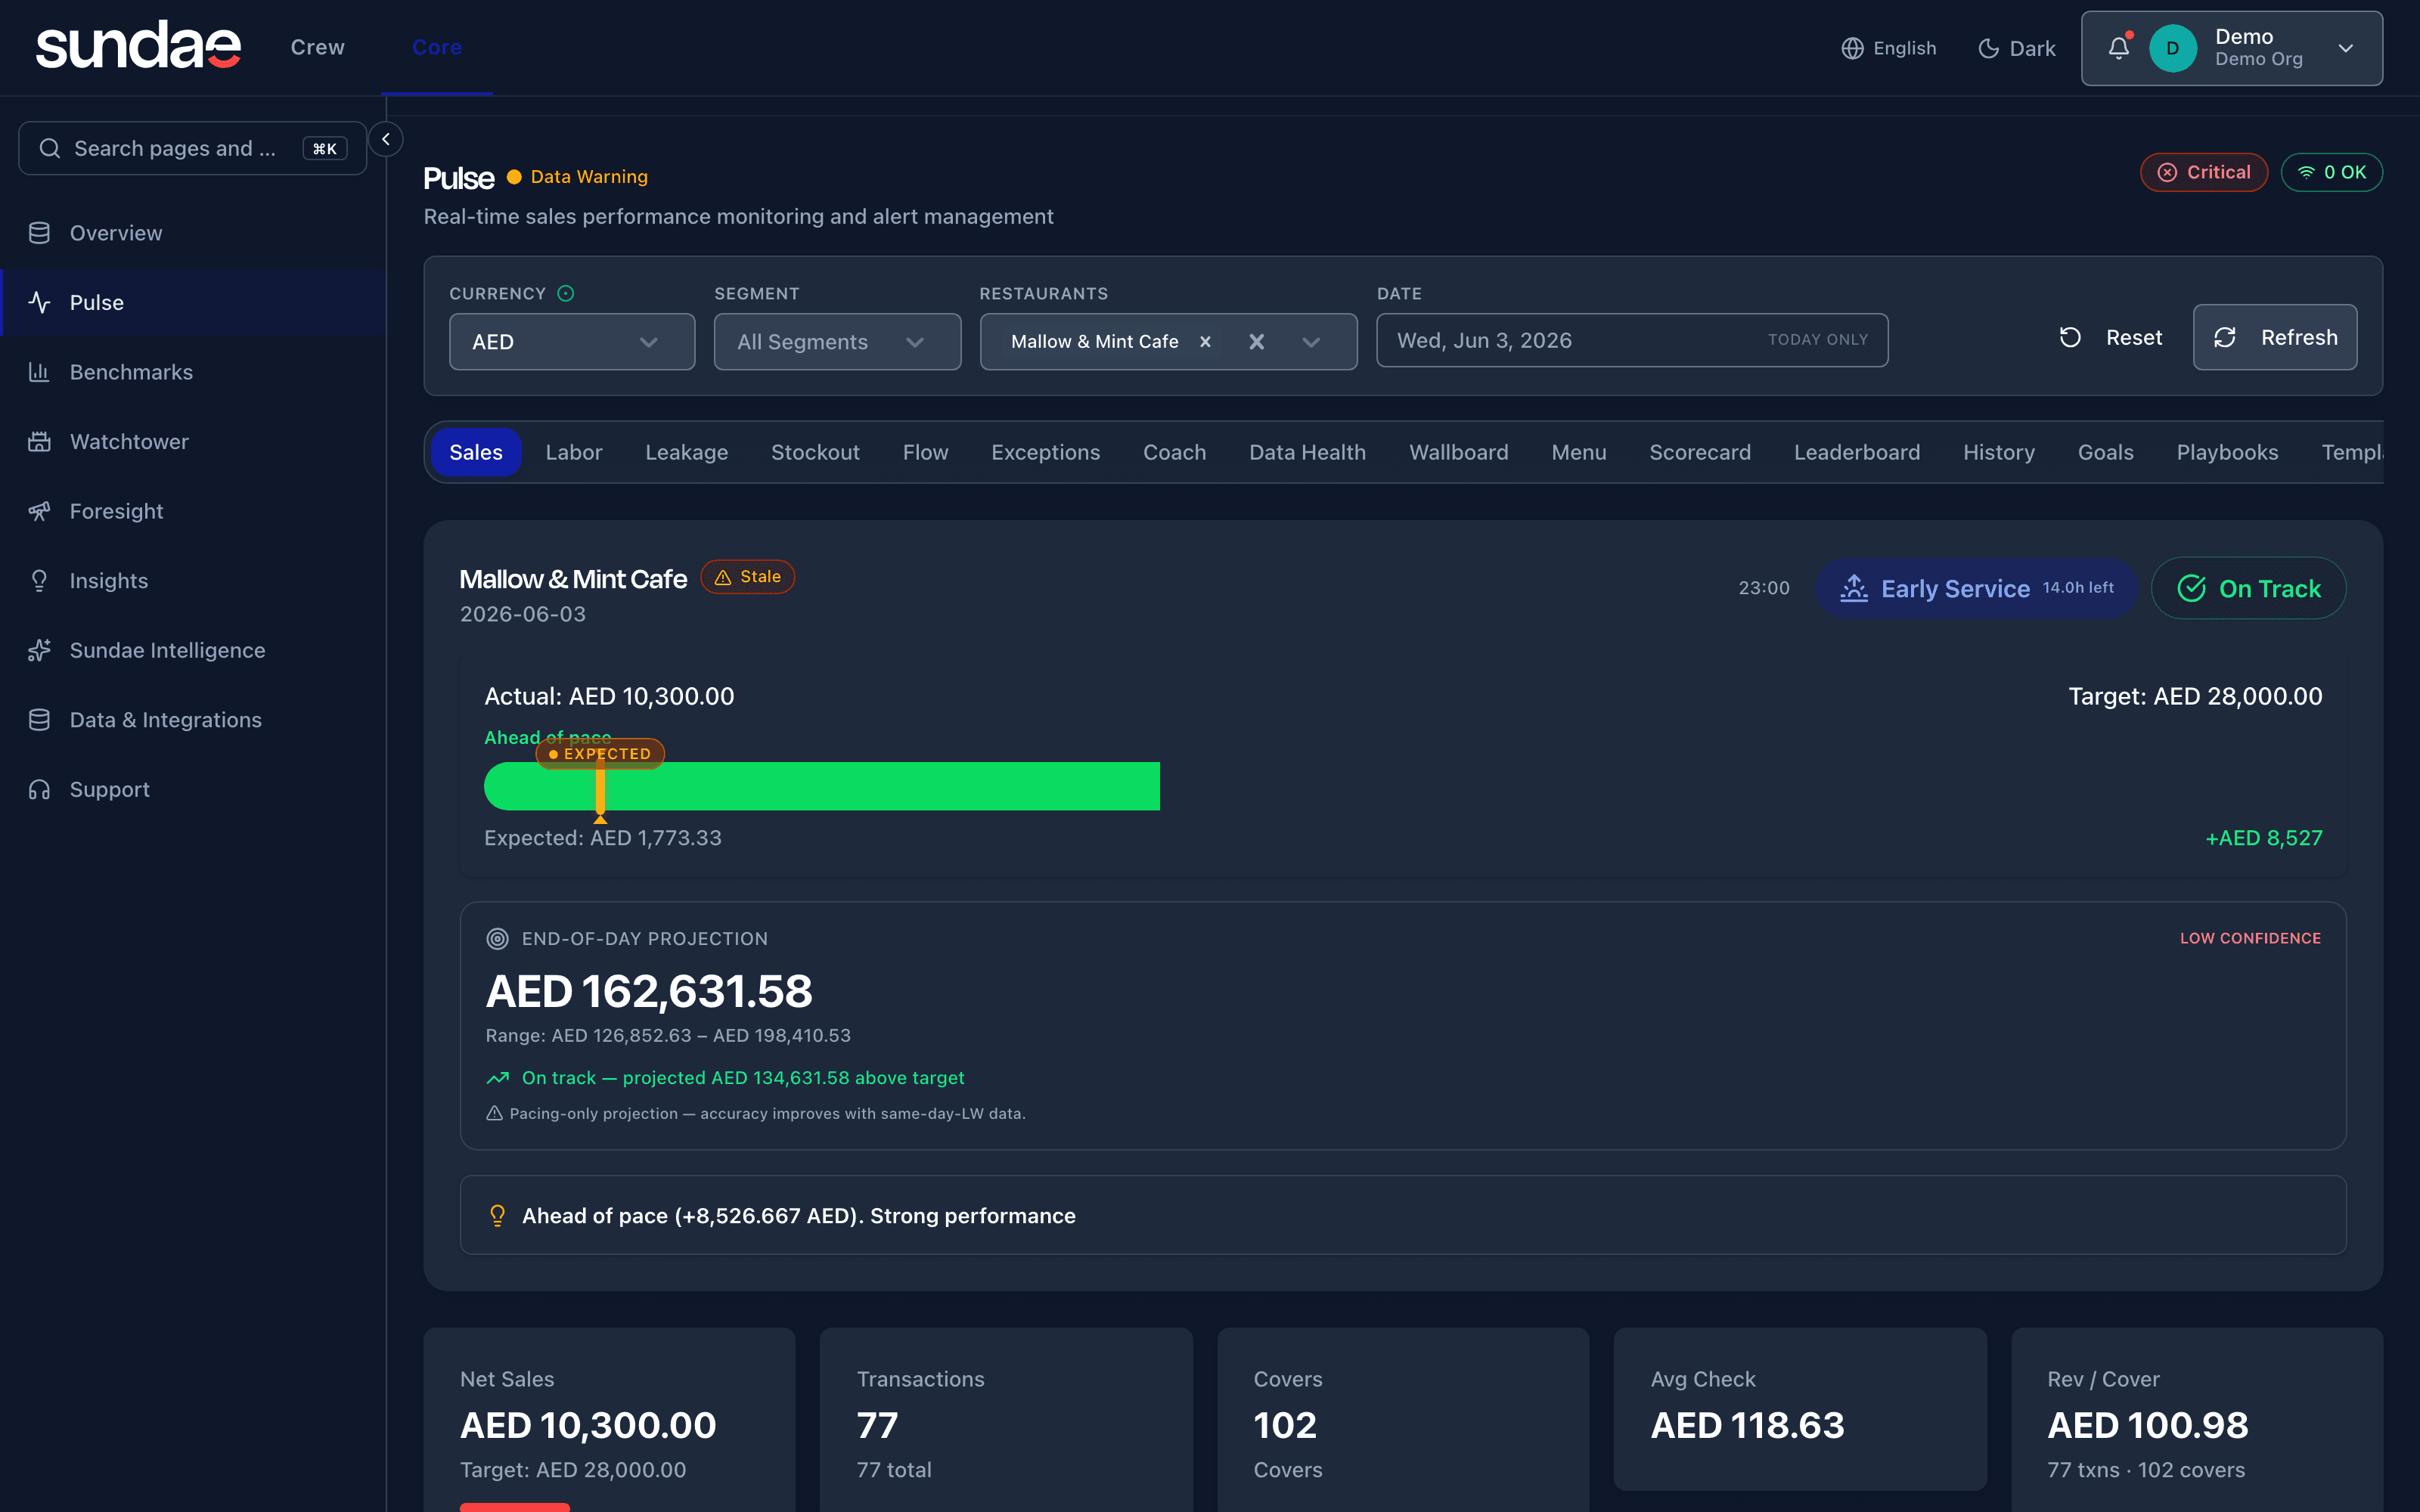

Sales & Pace
Intraday sales pacing, KPIs, and hourly trend visualization
Labor Live
Intraday labor pacing, overtime risk tracking, and break compliance
Leakage Monitoring
Real-time void, comp, and discount monitoring per shift
Flow
Throughput bottlenecks, backlog, and kitchen pacing metrics
Menu Intelligence
Item catalog, classification matrix (Stars/Plowhorses/Puzzles/Dogs)
Alerts & Playbooks
Automated response workflows triggered by exceptions
Sundae Coach
Shift-level coaching signals for Sales, Leakage, and Flow
Portfolio Leaderboard
Multi-outlet performance comparison with streak tracking
Wallboard Mode
Full-screen display for kitchen or front-of-house screens
Connect All Your Systems
Core connects across 12 data domains with 200+ vendor integrations.
POS Systems
Oracle MICROS Simphony, Square, Toast, Clover, plus direct database connectors
Labor/Workforce
7shifts, HotSchedules, Deputy
Inventory & Purchasing
MarketMan, Craftable, BinWise
Accounting
QuickBooks, Xero, Sage, FreshBooks
Reservations
OpenTable, Resy, SevenRooms, Tock
Delivery & Marketing
Deliverect, Uber Eats, DoorDash, Meta, Google Ads, Mailchimp
Add Modules for Specialized Intelligence
Deepen Core with focused modules for your specific operational challenges.
Labor Intelligence
Same-shift schedule optimization, predictive labor demand
Inventory Intelligence
Same-shift waste tracking, automated par levels
Purchasing Intelligence
Price movement tracking, vendor comparison
Marketing Intelligence
Same-shift campaign tracking, CAC monitoring
Reservations Intelligence
Same-shift booking patterns, table optimization
Watchtower brings the outside world into Core
Core tells you how you're performing right now. Watchtower tells you what's happening around you. Together, they give you the complete picture - internal operations and external market context in one intelligence layer.
CHOOSE YOUR PACKAGE
Four Core packages
Each package covers a different set of the four areas. Pick the one that matches where your margin is going.
Start here
Core Foundation
The operating baseline
$1,195
first location / month
One place to decide from, over POS, labor, cost and operations, refreshed while the shift is still running.
Then, per additional location
$175 (2-10) / $150 (11-25) / $125 (26-50) / $105 (51-100)
- ✓14,000 AI credits / month
- ✓Covers Revenue & Profit
Best for:
Groups getting off spreadsheets and disconnected dashboards
Most Popular
Core Margin
Depth on cost and leakage
$1,650
first location / month
Theoretical vs. actual usage, waste, shrinkage, voids and comps, and item-level contribution.
Then, per additional location
$245 (2-10) / $210 (11-25) / $175 (26-50) / $145 (51-100)
- ✓16,000 AI credits / month
- ✓Covers Revenue & Profit, Food & Supply
Best for:
Operators whose margin is leaking faster than they can see it
Demand side
Core Growth
Depth on demand
$1,925
first location / month
Guest cohorts and lifetime value, promo attribution by channel, delivery margin after commission.
Then, per additional location
$260 (2-10) / $225 (11-25) / $190 (26-50) / $155 (51-100)
- ✓18,000 AI credits / month
- ✓Covers Revenue & Profit, Guest & Market
Best for:
Groups pushing on repeat revenue and channel mix
Full depth
Core Performance
Multi-brand, multi-region
$2,980
first location / month
Consolidation across brands and regions, cross-module correlation, governed access with audit trails.
Then, per additional location
$409 (2-10) / $348 (11-25) / $290 (26-50) / $236 (51-100)
- ✓24,000 AI credits / month
- ✓Covers all four areas, incl. Foresight & Action
Best for:
Large groups running several brands or several markets
Frequently Asked Questions
How do the four Core packages differ?
They cover different areas, not the same ground at different depths. Foundation is the operating baseline; Margin adds cost and leakage depth; Growth adds guest, promo and channel depth; Performance adds multi-brand and multi-region consolidation with governed access.
Can I move up a package later?
Yes. Your full connected history is preserved and nothing is re-onboarded - you change the depth, not the data.
Is Core worth it at five locations?
Yes. Five locations carry the package anchor and the first band, and get the same coverage a fifty-location group gets. The location bands only start to matter as you add sites.
Can Core handle multiple POS systems?
Yes. Core connects across mixed POS estates, and Core Performance adds consolidation across brands and regions on top.
Can I use Core with Watchtower?
Highly recommended. Core provides internal intelligence, Watchtower adds external market intelligence for complete visibility.
Can I use Core with Modules?
Yes. All 5 specialized modules work with Core to deepen intelligence in specific operational areas.
SEE CORE IN ACTION
Every Core surface, in detail.
Real operator-workspace surfaces from the live product.
Daily Insights
C-SuiteMulti-location
Tomorrow read before it happens - weather, expected lunch and dinner traffic, and nearby competitor activity all fold into one clear recommendation, like staffing an extra front-of-house hand for the lunch window, so you plan the day instead of reacting to it.
Sundae Core →Screenshots represent live in-product surfaces. Click any image to enlarge. Synthetic data shown for illustration. Take the Operations Diagnostic to see what your view would look like.
Stop Reporting the Leak. Recover It.
Watch Core find the leak, route the fix, and measure the recovered margin against your baseline - on your actual data.