Loading...
Sundae Intelligence
Ask Your Data Anything. Get Answers in Seconds.
Natural language questions, structured visual answers - powered by your POS, inventory, labor, and delivery data in real time.
Web AppTelegramSlackMicrosoft TeamsVoice Input

CONVERSATIONAL AI
Ask in plain English. Decide in seconds.
Your data, answered on web, Slack, or Teams - grounded in your real numbers.
Four Specialized Modes
Each mode changes how intelligence is generated - from quick Q&A to stakeholder-ready reports.
⌘ 1
Chat
DefaultAsk anything about your data. Get structured answers with interactive charts and KPI cards.
⌘ 2
Analyst
Deep DiveDeep analysis with clarifying questions, confidence levels, and cross-referenced data sources.
⌘ 3
Monitor
Real-timeAuto-refreshing KPI dashboard. 60-second cycles. Highlights anomalies exceeding 15% deviation.
⌘ 4
Report
ExecutiveStakeholder-ready reports with executive summary, key metrics, and recommendations.
Ask Anything About Your Business
From quick checks to deep analysis - just type, speak, or use a slash command.
“What was my best-selling item last Thursday?”
“Compare labor costs across my downtown locations”
“Why did revenue drop at Location 5 this week?”
“Show me locations where labor cost exceeded 32%”
/forecast next week's revenue for all outlets
/benchmark my RevPASH against nearby competitors
Smart Command Bar
Autocomplete, slash commands, voice input, @mentions, and file attachments.
Smart Autocomplete
Suggests recent queries, metric names, and data fields as you type - powered by your connected data sources.
9 Slash Commands
/compare, /report, /alert, /schedule, /export, /forecast, /benchmark, /explain, /share - each triggers an optimized intelligence prompt.
Voice Input & Wake Word
Click the mic to dictate queries, or enable "Hey Sundae" always-listening mode for hands-free operation.
File Attachments
Attach CSV, Excel, images, or screenshots - ask questions about uploaded data with inline preview and parsing.
Rich, Interactive Response Cards
Structured, interactive cards - not plain text. Every response is visual and explorable.
KPI Cards
Single metrics with value, period-over-period change, 7-day sparklines, and segment breakdown charts.
Interactive Charts
Bar, line, area, pie, and scatter - with type switching, click drill-down, annotations, fullscreen, and CSV export.
Analysis Cards
Structured insights with sentiment tagging (positive/negative/neutral) and supporting data evidence.
Comparison Cards
Side-by-side metric comparisons across locations, time periods, or menu categories with variance highlighting.
Proactive Anomaly Detection
Continuously scans your data for unusual patterns - surfacing issues before you even think to ask.
Revenue anomaly (vs. 30-day average)
Order count spikes or drops
Average ticket size shifts
Off-hours activity detection
Top-selling item changes
Payment method shifts
Smart Welcome Briefing
Every new session starts with a personalized briefing:
- ✓Time-based greeting with your name
- ✓3 live KPI cards - today's revenue, orders, and top item
- ✓4 smart suggestions prioritized by active anomalies
- ✓Data coverage indicator showing connected sources
Organization & Collaboration
Pin, folder, schedule, and share - your intelligence workspace, organized your way.
Thread Management
- ✓Pin important conversations
- ✓Create folders and drag to organize
- ✓Cross-folder collections
- ✓Smart date grouping (Today, This Week, etc.)
- ✓Search across all thread content
Scheduled Reports
- ✓Daily, weekly, monthly, or custom cron
- ✓Deliver via email, Slack, Telegram, Teams, webhook
- ✓Toggle active/paused per schedule
- ✓Run Now for instant delivery
- ✓Execution tracking with failure alerts
Team Features
- ✓Share dialog with permission levels
- ✓@Mention team members in queries
- ✓Decision log (Action Taken / Monitoring / Dismissed)
- ✓Context panel with SQL, sources, and latency
- ✓Feedback per message (thumbs up/down)
Why Sundae Intelligence Is Different
Not another dashboard. A fundamentally different approach to decision intelligence.
Conversational, Not Dashboard-Based
No dashboards to configure. No reports to build. Ask a question, get a visual answer in seconds.
Finds Problems Before You Do
Continuously monitors revenue, orders, tickets, and menu performance - surfacing anomalies before they become expensive.
Interactive Charts with Drill-Down
Click any data point to explore deeper. Leave annotations for your team. Toggle chart types on the fly.
Scheduled Intelligence Delivery
Daily, weekly, or monthly insights delivered via email, Slack, Telegram, Teams, or webhook.
Connected to Everything
Pulls from every connected source - POS, labor, inventory, reservations, delivery. Fully scoped per organization.
Decision Tracking
Track what you did with each insight. Log actions taken, items monitored, or decisions dismissed.
Built for Every Market
RTL / Arabic SupportFull Keyboard ShortcutsDark ModeMobile ResponsiveARIA AccessibleReal-time Streaming4 Database ConnectorsMulti-Tenant Isolation
On mobile
Your whole operation, in your pocket
Sundae is a mobile app, not a shrunk-down dashboard. See the answer in a glance, open the chart for detail, and act — from the floor or on the go, in seconds.
3:00
Swipe for more →
SEE INTELLIGENCE IN ACTION
Every Intelligence surface, in detail.
Real decision surfaces from the live product.
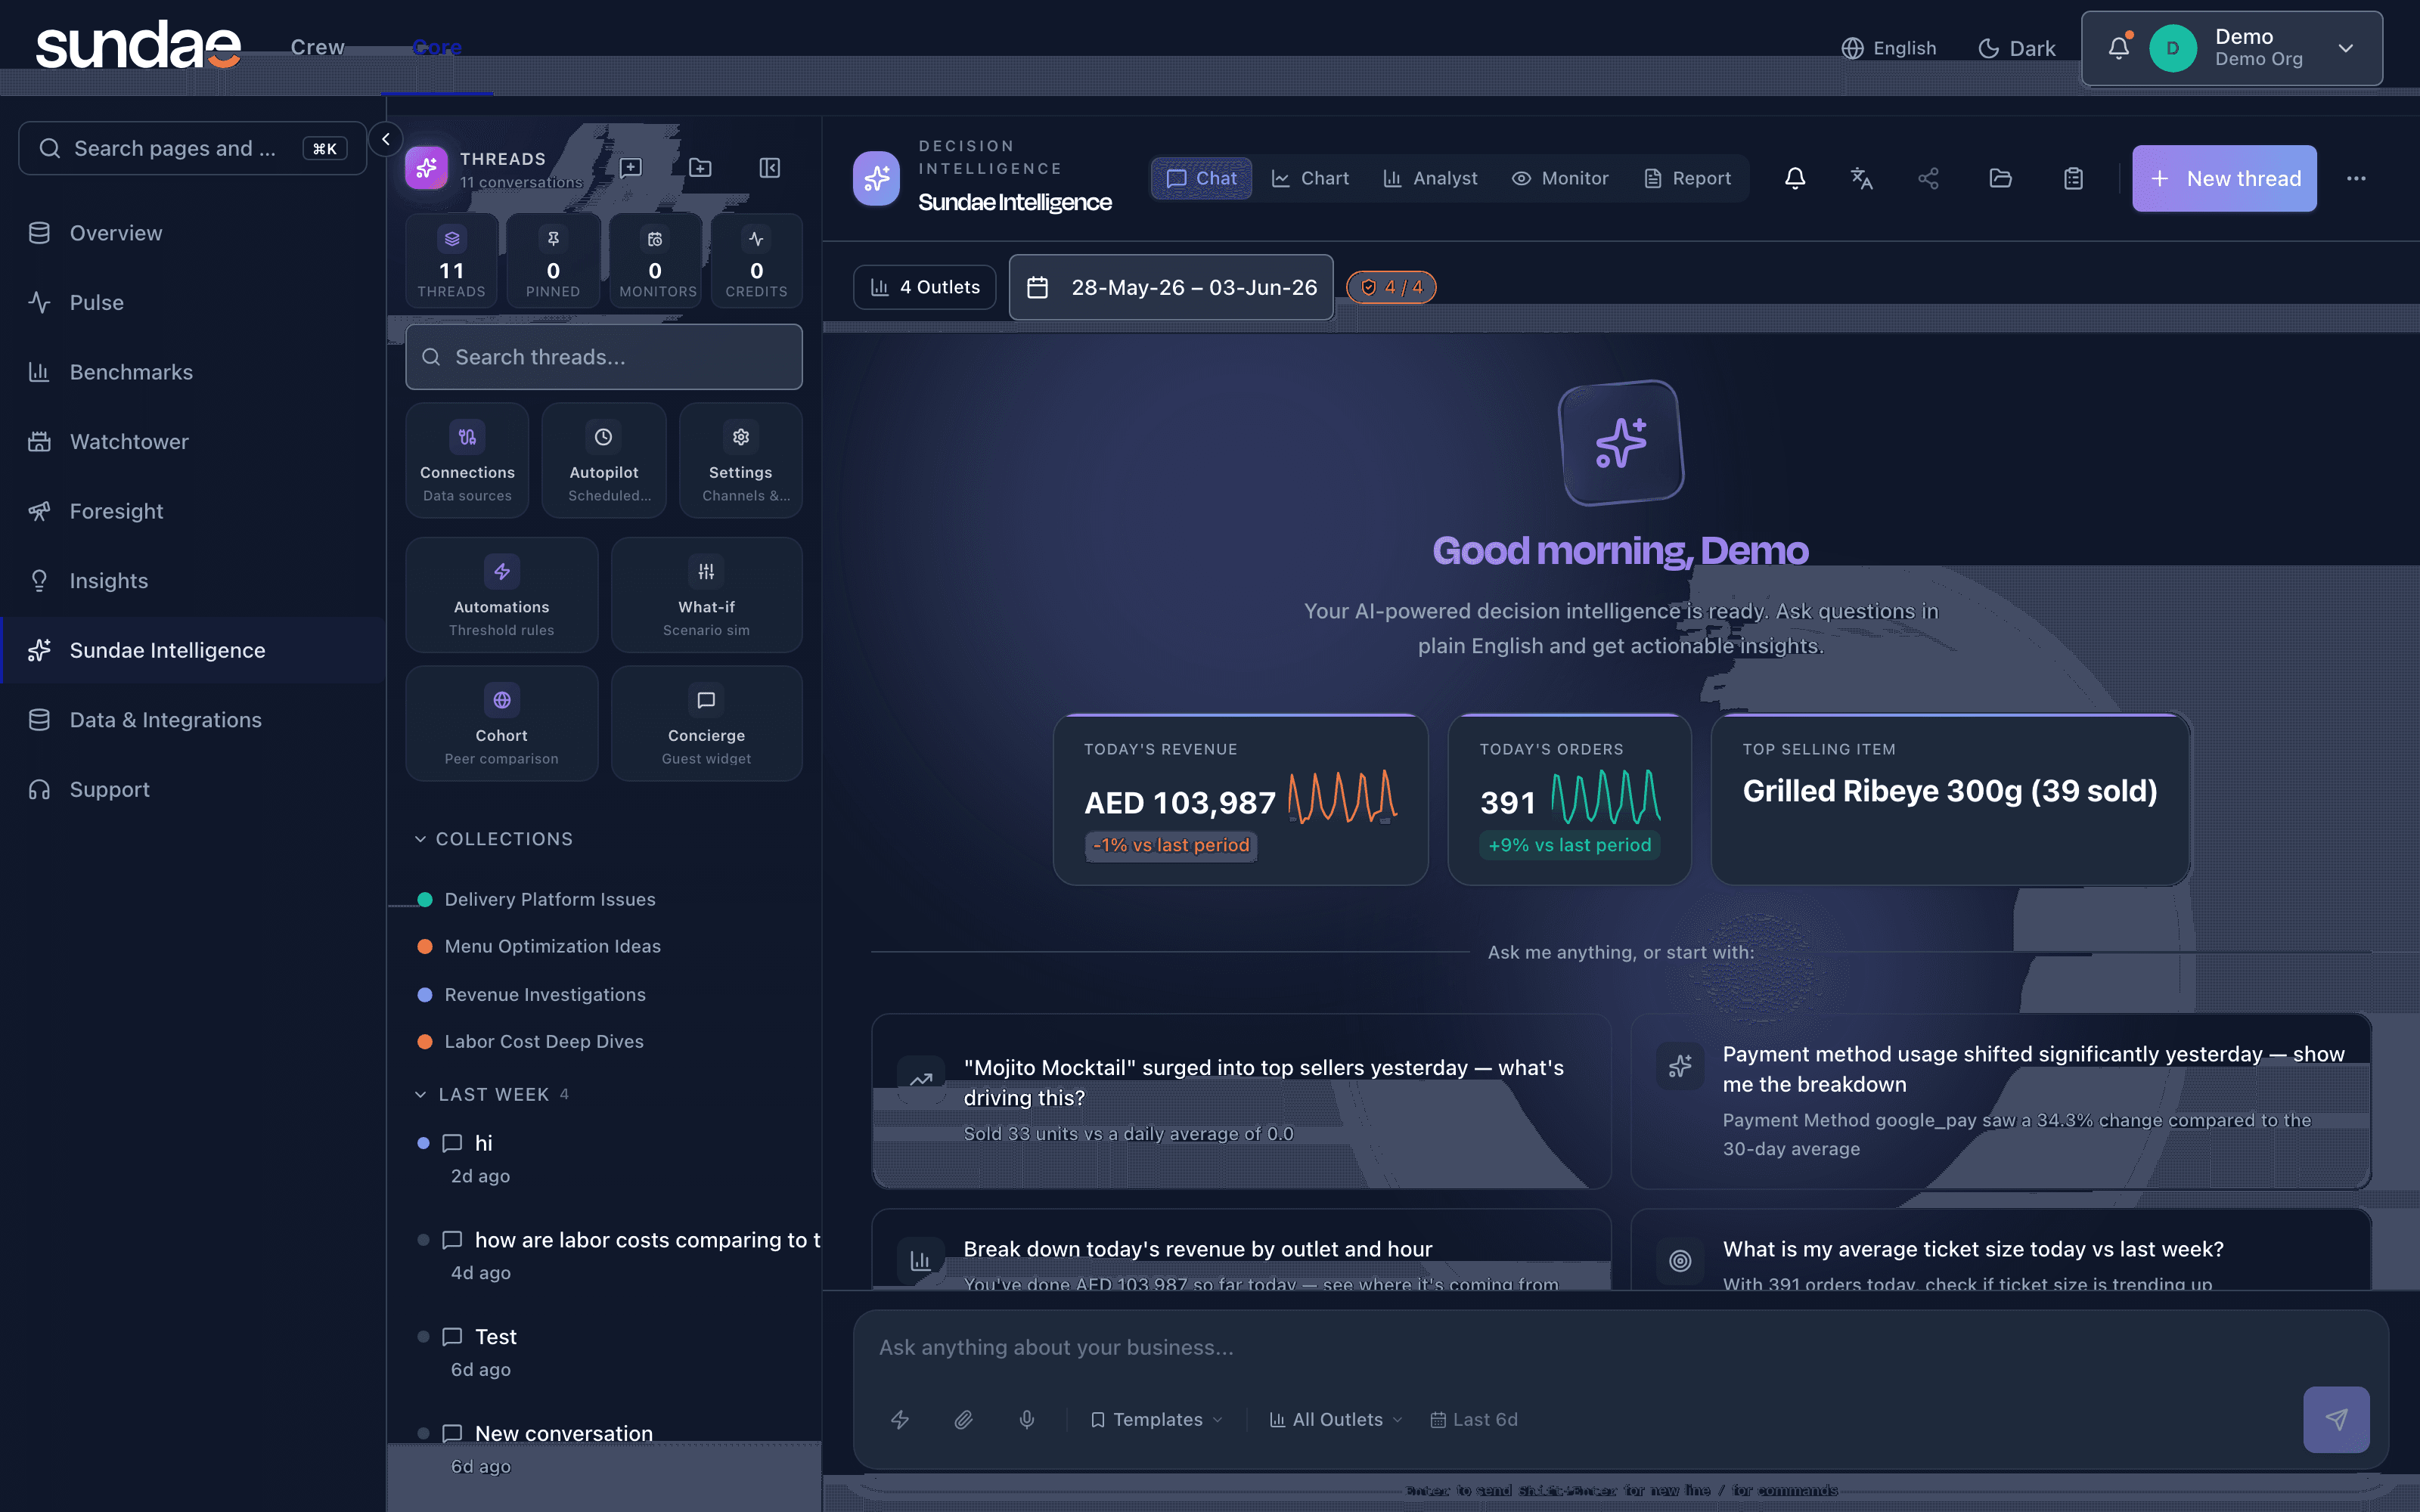
Sundae Intelligence
OperationsFinance
Ask your data in plain language and get an answer grounded in tonight's real numbers - AED 96,555 in revenue across 379 orders, your top sellers, and a suggested follow-up when something like Banana Bread suddenly climbs the menu. Threads and collections keep every line of questioning where you left it.
Sundae Intelligence →Intelligence - Scenario Simulator
FinanceOperations
Pull one lever and watch it ripple through the whole model - covers and ticket flow into revenue, then food cost and labor, all the way down to EBITDA - with every driver on a slider, so you can see what a single change is really worth before you make it.
Sundae Intelligence →Screenshots represent live in-product surfaces. Click any image to enlarge. Synthetic data shown for illustration. Take the Operations Diagnostic to see what your view would look like.